デバッグ
Parcel はデフォルトで自動的にソースマップを生成するため、Parcel でデバッグを設定するのはほとんどの場合、最小限の労力で済みます。
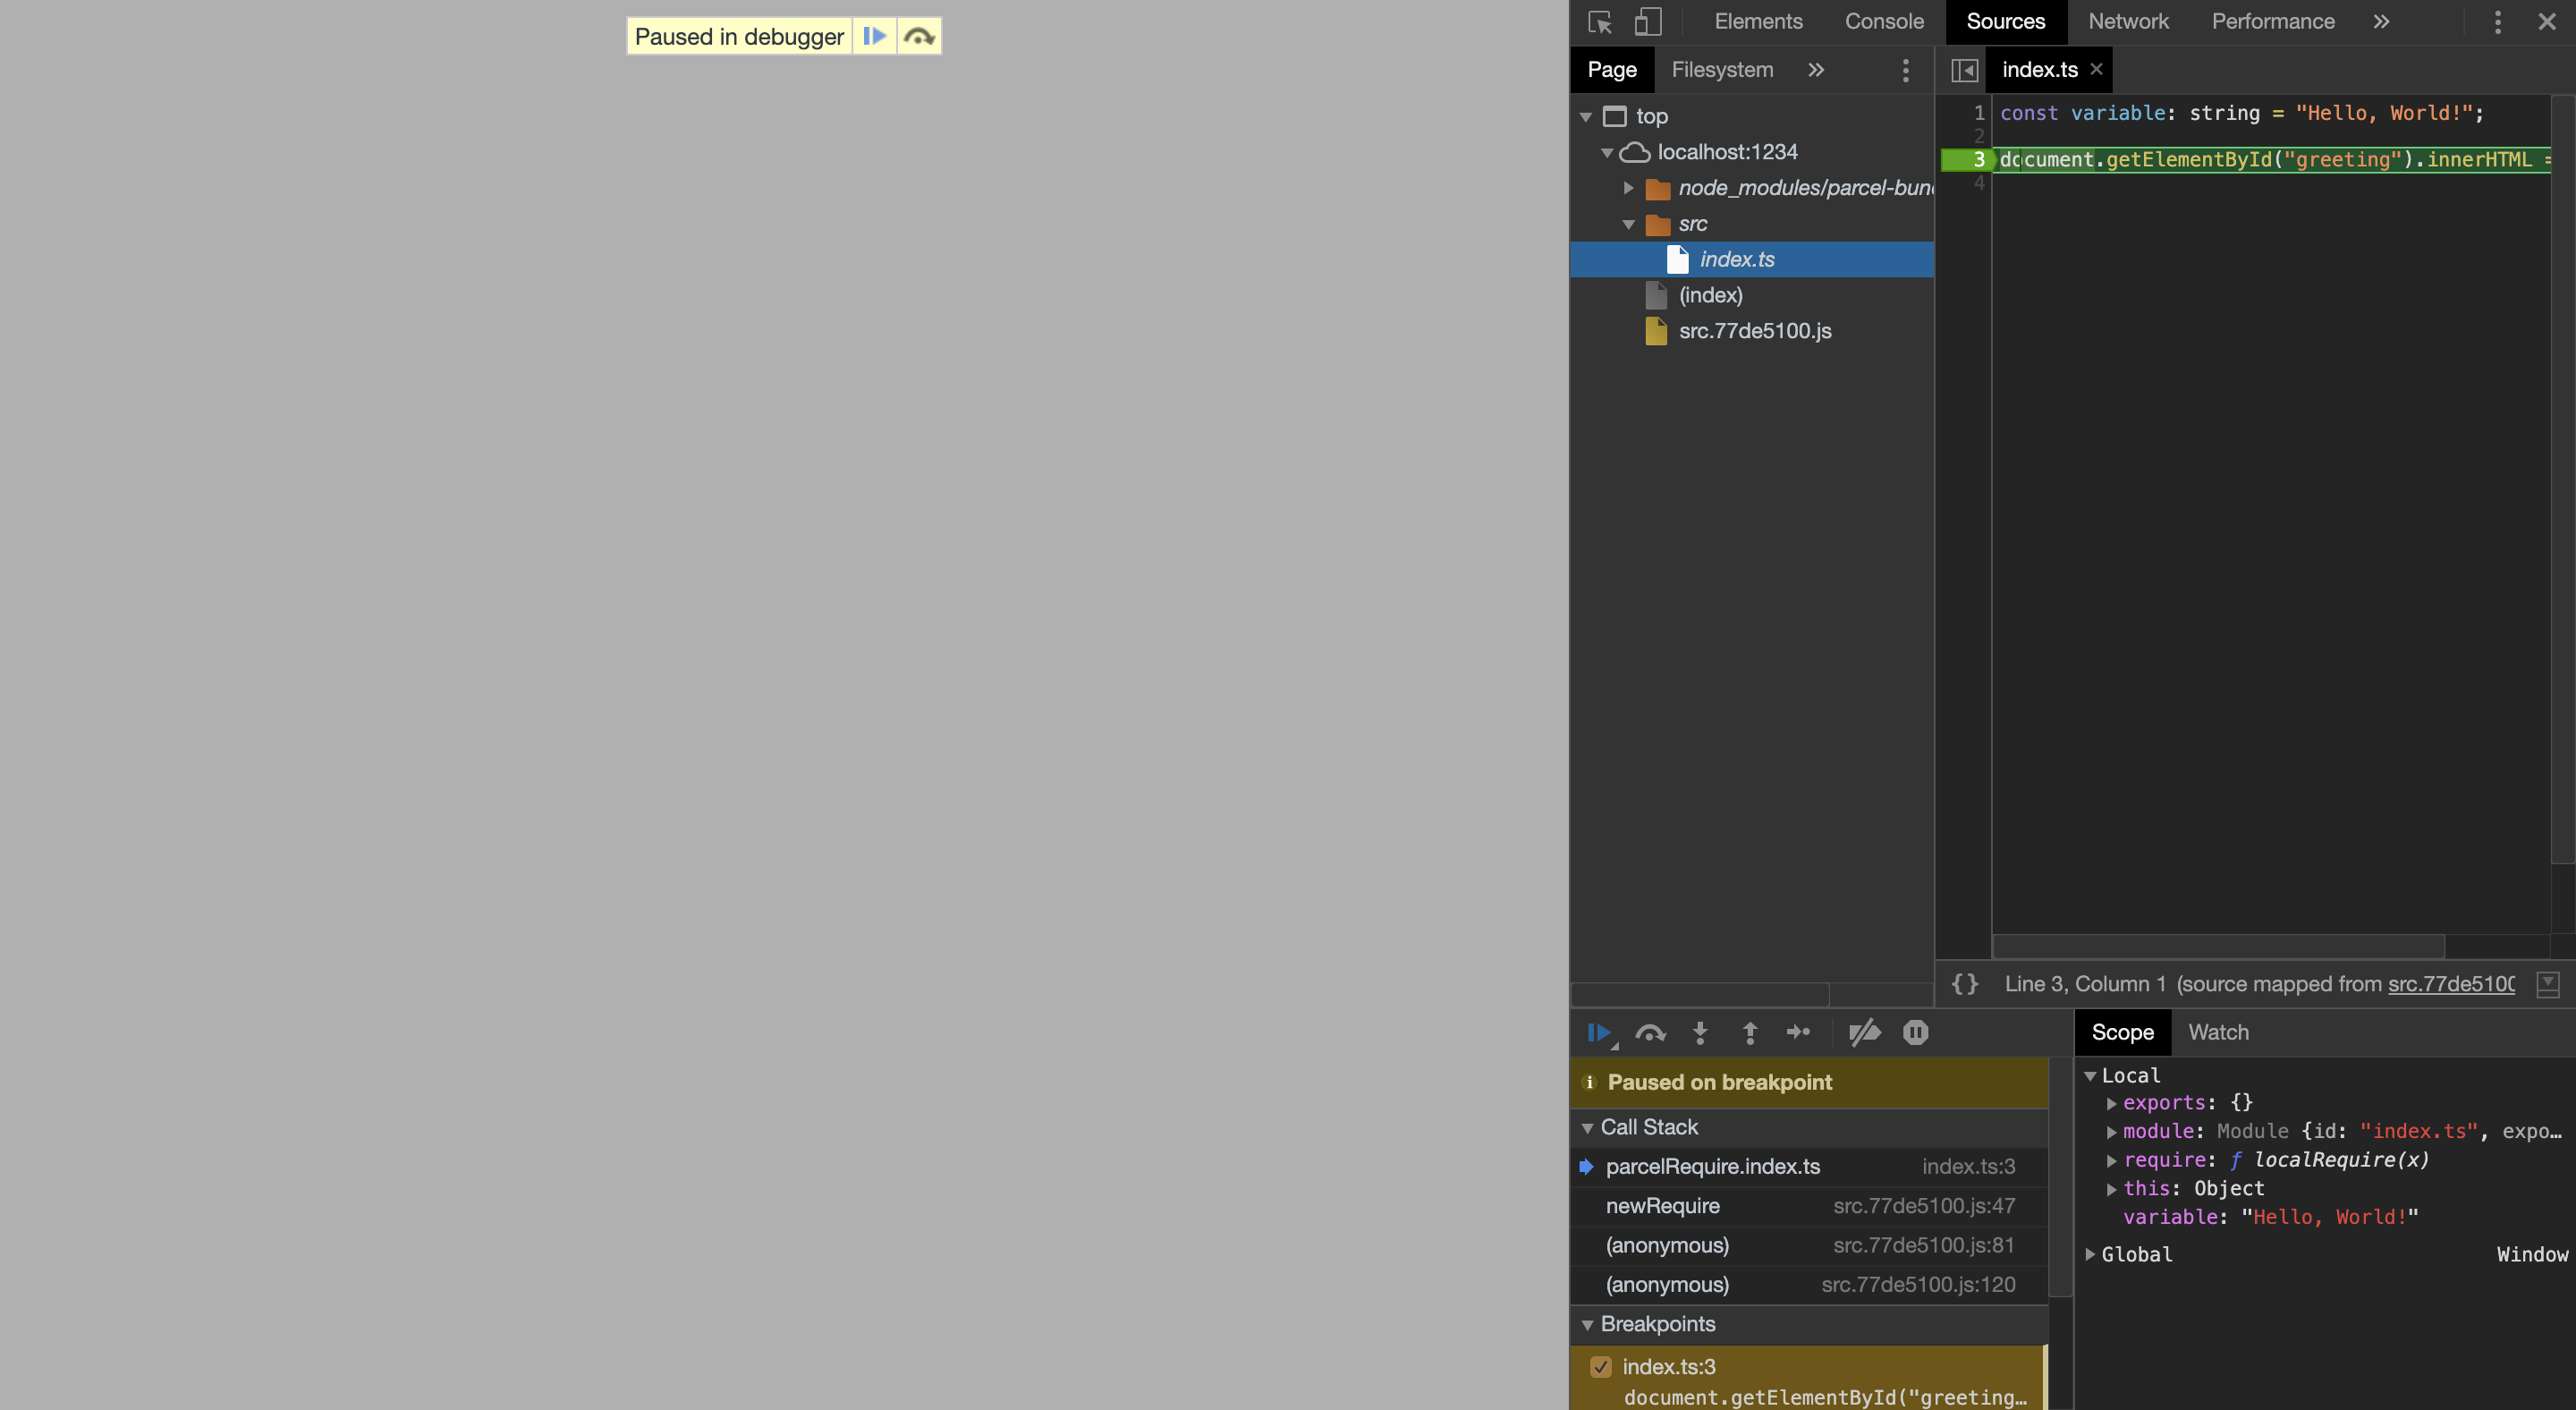
Chrome デベロッパーツール
#ソースマップが有効になっていることを前提とすると、追加の構成は必要ありません。たとえば、次のようないくつかのフォルダの構造があるとします
src/index.html
<!DOCTYPE html>
<html>
  <head>
    <title>Chrome Debugging Example</title>
  </head>
  <body>
    <h1 id="greeting"></h1>
    <script src="./index.ts"></script>
  </body>
</html>
src/index.ts
const variable: string = "Hello, World!";

document.getElementById("greeting").innerHTML = variable;この設定では、parcel src/index.html を実行して、次のようにソースコードにブレークポイントを設定できます
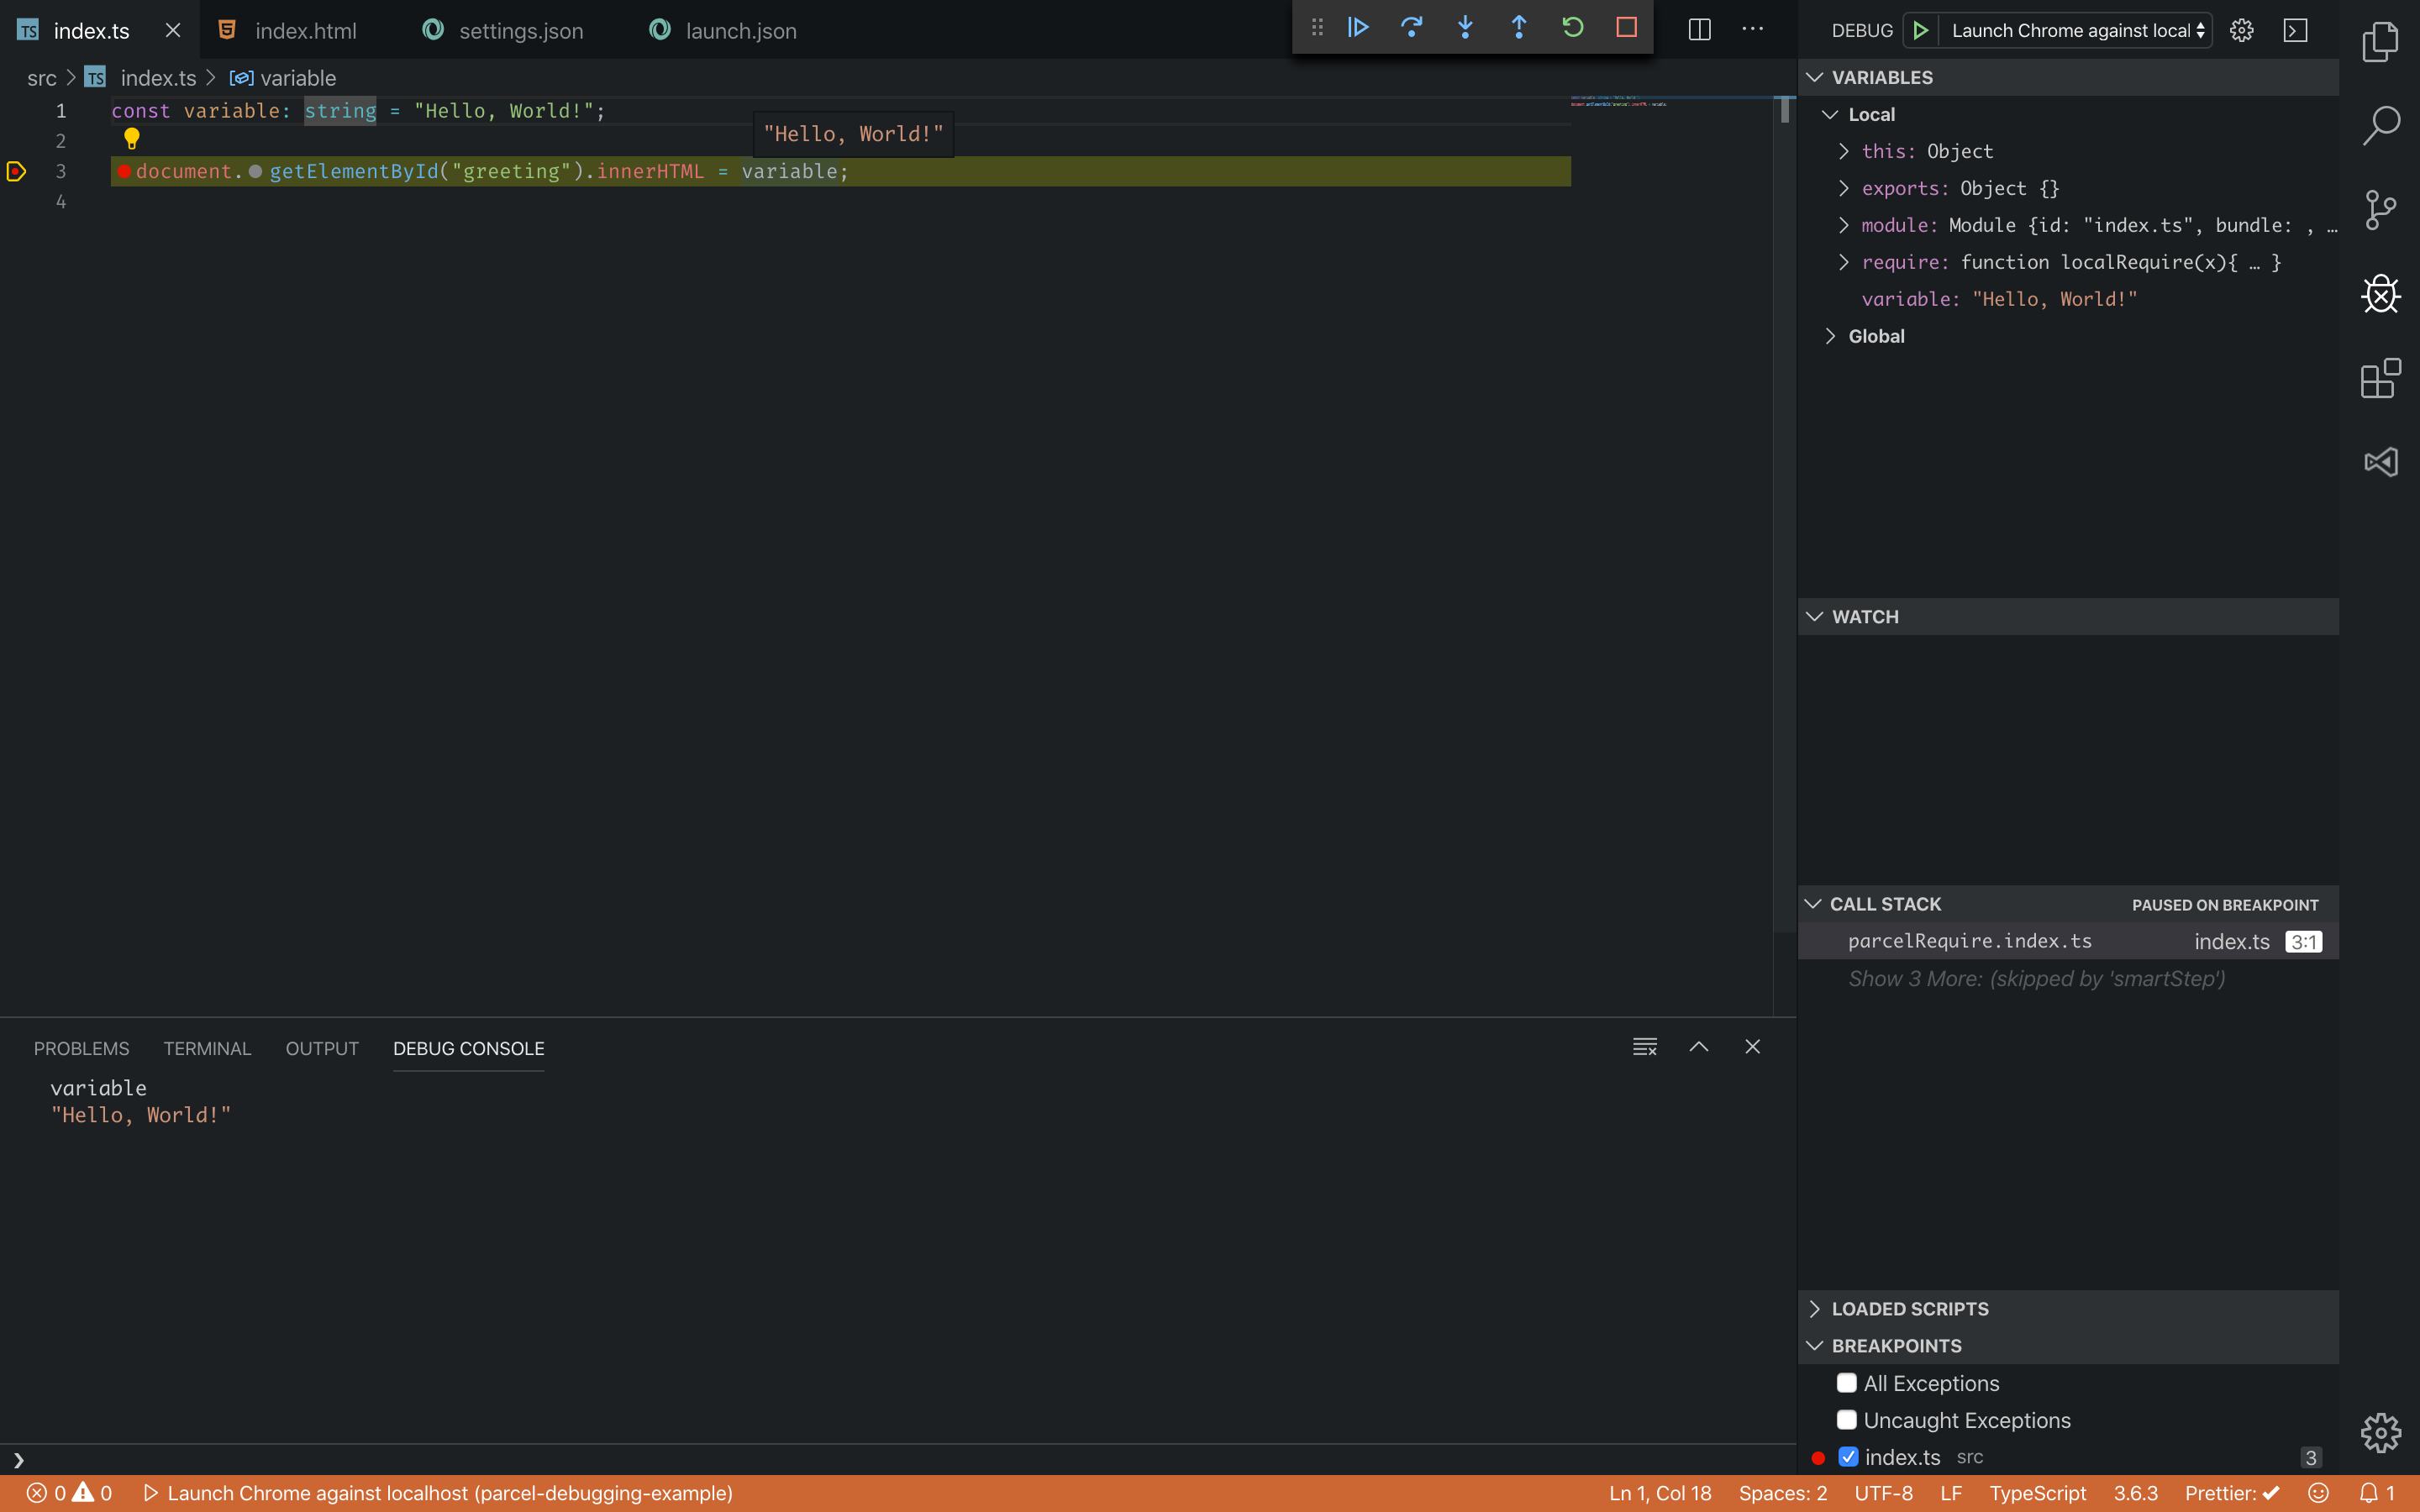
Visual Studio Code
#Debugger for Chrome 拡張機能で、Chrome デベロッパーツールの例で示したようなフォルダ/ファイル構造を使用すると、次の launch.json が使用できます
launch.json
{
  // Use IntelliSense to learn about possible attributes.
  // Hover to view descriptions of existing attributes.
  // For more information, visit: https://go.microsoft.com/fwlink/?linkid=830387
  "version": "0.2.0",
  "configurations": [
    {
      "type": "chrome",
      "request": "launch",
      "name": "Launch Chrome against localhost",
      "url": "https://:1234",
      "webRoot": "${workspaceFolder}",
      "breakOnLoad": true,
      "sourceMapPathOverrides": {
        "/__parcel_source_root/*": "${webRoot}/*"
      }
    }
  ]
}
次に、エントリポイント(ここでは index.html)を使用して Parcel デブサーバーを開始する必要があります
$ parcel src/index.html
ここで最後のステップは、デバッグパネルの緑色の矢印をクリックして実際にデバッグプロセスを開始することです。これで、コードにブレークポイントを設定できるようになります。最終的な結果は次のようになるはずです